- We Study Markets
- Posts
- 🎙️ Bulls & Bears
🎙️ Bulls & Bears
[5 minutes to read] Plus: Behind Tesla's monster rally
Matthew Gutierrez & Shawn O'Malley
July 08, 2024

By Matthew Gutierrez and Shawn O’Malley
🤔 What have been the very best asset classes since 2011? How about the worst?
Today’s charts show the S&P 500’s top first-half performers, plus every major asset class’s returns since 2011.
Unsurprisingly, Bitcoin and U.S. growth stocks have led the way. The question at the top of investors’ minds: Will those asset classes keep leading the way for the next decade?
— Matthew & Shawn
Here’s today’s rundown:

Today, we'll discuss the biggest stories in markets:
Why this might not be like the dotcom bubble
Behind Tesla’s $220 billion rally
This, and more, in just 5 minutes to read.
POP QUIZ
Chart(s) of the Day


Personalized ED treatments, straight to your door

Personalized ED treatments, straight to your door.
Hims has helped thousands of men get support for ED, and they’re ready to support you with custom solutions made with clinically proven ingredients.
Take their free assessment to see if a prescription is right for you.
In The News
💻 The Case for Why This Isn’t Like the Dotcom Bubble (Yet)

Valuations for companies like Microsoft soared in the late 1990s
Bubble talk, bubble talk, bubble talk. Another strong bull market means more headlines about a bubble and, increasingly, comparisons to the frothy stock market of 2021 and even that of the roaring 1990s dot-com bubble.
While the S&P 500 is top-heavy, with a few large tech stocks driving much of its recent performance, the market may not be as overheated as some headlines suggest. The top 10 stocks now account for about one-third of the index, which is a high concentration. But unlike the dot-com bubble era, the leading companies have strong fundamentals to support (or at least mostly support) their valuations.
Bulls and bears: The current stock market bull run began on Oct. 12, 2022. Market strategist Ed Yardeni pointed out in a recent note to clients that skeptics are concerned about projected earnings growth being too high, narrowing market breadth, stretched valuations, and the fear of a severe selloff after nearly two years of gains.
Yardeni also noted that many companies have broken earnings records, the upcoming earnings season is slated to be strong, and earnings breadth is improving: 83% of S&P 500 companies showed positive three-month changes in forward earnings.
Since the bull market began, the S&P 500 has risen 55.6%. Yardeni notes that excluding the Magnificent Seven stocks, the remaining 493 S&P 500 companies are up 36.4%. And while the overall S&P 500 forward P/E appears high at 21.2, the median forward P/E is a more reasonable 17.8, suggesting that valuations outside the largest companies are not stretched.

Why it matters:
Contrary to popular belief, the current stock market situation might not be akin to the dot-com bubble, and Nvidia is not comparable to Cisco from that era, according to several market analysts, strategists, and observers. Let’s explain.
Nvidia vs. Cisco: It’s a natural comparison. Hey, we compared them last week. But it’s worth another look because Cisco's forward P/E ratio (not a perfect measure, but a measure) peaked at 131 in March 2000, whereas Nvidia's current forward P/E is 45. Though Nvidia is not cheap, it’s far from the extreme valuations seen during the dot-com bubble.

Source: Daily Chartbook
Historical context: Just because a stock rallies doesn't mean it will then crash. Nvidia and Cisco are fundamentally different companies with distinct valuations and market conditions.
The top 10 stocks today trade at a P/E of 30, compared to 47 in 2000.
The tech sector's forward P/E is currently 30.4, much lower than the 55.5 seen in March 2000.
Tech and communications: These sectors account for 40.7% of the S&P 500's market cap today, similar to dot-com levels, but they contribute 32.9% of forward earnings compared to 24% in 2000, indicating stronger fundamentals.
Nasdaq Performance: From July 1996 to March 2000, the Nasdaq rallied about 700%. Since March 2020, it has only rallied 200%, suggesting a more measured growth.
Final thoughts: Numerous analysts note that while a pullback is always possible, the current market and Nvidia's situation are not directly comparable to the dot-com bubble or Cisco in 2000. As always, this isn’t investment advice — it’s merely one view worth considering.
More Headlines
🏠 America’s wealthiest suburbs, ranked
💵 Cashless: The death of cash transactions around the world
🥵 Extreme heat alerts in effect for over 150 million Americans
📉 10-year Treasury yield falls after unemployment rate rises
😃 Investors look to upcoming earnings to keep stock market rally going
✈️ TSA breaks screening record with over 3 million travelers on Sunday
🚗 Tesla’s $220 Billion Rally Stings Hedge Funds

Tesla is back in the fast lane.
The EV maker’s Q2 2024 deliveries exceeded analyst expectations but marked the company's first consecutive quarterly decline in over a decade. Elon Musk’s company delivered 443,956 vehicles, surpassing the Wall Street estimate of 439,302. That prompted a major stock rally.
The rally added over $220 billion to Tesla's market cap, with the stock gaining about 40% over the streak. The better-than-expected Q2 delivery numbers partly fueled this surge. Tesla still faces challenges, including heightened competition in China, which has led to price wars and demand concerns. But after a brutal stretch for Tesla, bulls got some relief.
Rear-view mirror: Wedbush Securities analyst Daniel Ives stated, "The worst is in the rear-view mirror for Tesla," noting a "mini rebound" in China during the June quarter. The company’s winning streak has pushed its shares into positive territory for the first time in 2024. (Its shares are up about 1,445% over the past five years vs. 85% for the S&P 500.)
Positivity in China: There are positive signs in the Chinese market for Tesla. A government statement revealed that several state-owned companies in Shanghai have purchased Tesla's Model Y for business use.
Meanwhile, the rally has caught many professional money managers off-guard. It’s been especially bad for hedge funds that bet against it. At the end of June 2024, about 18% of over 500 hedge funds tracked by data provider Hazeltree held short positions on Tesla, the highest percentage in more than a year. That increased from just under 15% at the end of March.

Source: Bloomberg
Why it matters:
Tesla has been the worst-performing Magnificent Seven stock by a wide margin. Could this be the start of a broader turnaround?
Big-time losses: For one, the popular hedge fund short bets backfired when Tesla released its Q2 2024 vehicle delivery and production report on July 2, which exceeded Wall Street's expectations. The rally has since resulted in estimated losses of roughly $3.5 billion for short sellers.
Musk responded to the news of hedge funds' losses with a crying face emoji on his social media platform X. Musk has a history of confronting Tesla short sellers, often predicting their downfall and criticizing their positions, given that Tesla has been one of the more shorted stocks even as its shares have soared since going public in 2010.

Zoom out: The tug-of-war between Tesla bulls and bears is nothing new. It’s an innovative company led by a polarizing leader in an increasingly competitive industry, with a notoriously difficult valuation to assess.
As one chief investment officer put it, “Basically, it’s not clear whether investors are dealing with a top company with a great management team or whether it’s a challenged franchise with deficient corporate governance.”
The whole situation also highlights the ongoing uncertainty surrounding the electric vehicle market. While the industry benefits from tax credits and is crucial for achieving global net-zero emissions goals, it also faces tariff wars and consumer perception issues.
That complexity has led some hedge fund managers to avoid taking positions on Tesla altogether, citing difficulties in assessing the company's true value and potential.
As Tesla prepares for its earnings call on July 23, investors and analysts will be watching closely.
Together With Long Angle
Private Markets, Powered by Collective Expertise of HNW Investors
Investing in private market opportunities is challenging. The difference between success and failure in private markets comes down to your network.
Long Angle is a vetted community of 3,000 high-net-worth investors who leverage their collective expertise and scale to access and underwrite some of the world’s best alternative asset investments.
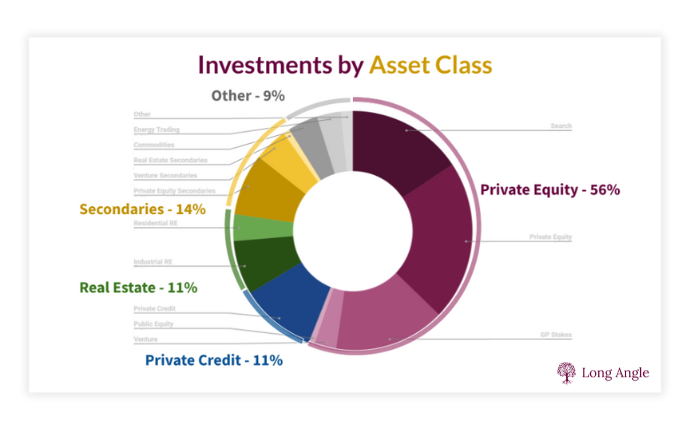
After reviewing hundreds of opportunities, Long Angle diligence deal teams greenlight a dozen deals each year. Asset classes range from Private Equity, Search Funds, and Private Credit to Secondaries, Real Estate, and Venture.
No membership fees. All members receive equal access to negotiated fee discounts powered by the community’s $45 billion in collective assets.
Quick Poll
Do you own shares in Tesla directly? Why or why not? |
On Friday, we asked: Out-of-office statuses are popping up everywhere as we move deeper into summer — have you taken your "big" vacation yet?

— One reader already enjoyed a trip to Yellowstone National Park. Others have visited Japan and various countries in Europe. “My big vacation (June in the UK and Ireland) is now over, but being retired, I only had to let those I exercise and volunteer with know that I was going to be away.”
— Other readers said they will take multiple summer vacations, not one big one. Another said they haven’t yet gone away, writing: “Things are extremely expensive, but the quality hasn’t improved at all.”
— Another respondent plans to go away in the fall. “My mother-in-law has been ill with health problems. My wife doesn’t feel like we can be a long way away right now, so the trip to Europe is pushed back to the fall.”
TRIVIA ANSWER
See you next time!
That's it for today on We Study Markets!
Enjoy reading this newsletter? Forward it to a friend.
Was this newsletter forwarded to you? Sign up here.
Use the promo code STOCKS15 at checkout for 15% off our popular course “How To Get Started With Stocks.”
Advertise with us.
Follow us on Twitter.
Keep an eye on your inbox for our newsletters on weekdays around 6pm EST and on weekends. If you have any feedback for us, simply respond to this email.
You can also leave your comments/suggestions/feedback anonymously here.
What did you think of today's newsletter? |
All the best,


P.S. The Investor's Podcast Network is excited to launch a subreddit devoted to our fans in discussing financial markets, stock picks, questions for our hosts, and much more!
Join our subreddit r/TheInvestorsPodcast today!
© The Investor's Podcast Network content is for educational purposes only. The calculators, videos, recommendations, and general investment ideas are not to be actioned with real money. Contact a professional and certified financial advisor before making any financial decisions. No one at The Investor's Podcast Network are professional money managers or financial advisors. The Investor’s Podcast Network and parent companies that own The Investor’s Podcast Network are not responsible for financial decisions made from using the materials provided in this email or on the website.